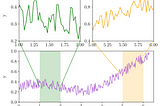
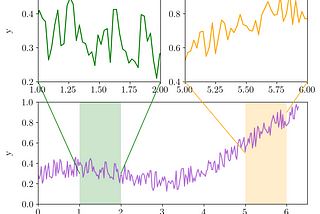
PinnedRizky Maulana NurhidayatinTowards Data Science5 Powerful Tricks to Visualize Your Data with MatplotlibHow to use LaTeX font, create zoom effect, outbox legend, continuous error, and adjust box pad marginSep 29, 20203Sep 29, 20203
PinnedRizky Maulana NurhidayatinTowards Data SciencePython Data Visualization with Matplotlib — Part 2Completed Matplotlib tutorials for Python plotting from basic to advanced, with 100+ examplesOct 31, 20203Oct 31, 20203
PinnedRizky Maulana NurhidayatinTowards Data SciencePython Data Visualization with Matplotlib — Part 1Completed Matplotlib tutorials for Python plotting from basic to advanced, with 100+ examplesOct 19, 20203Oct 19, 20203
Rizky Maulana NurhidayatinILLUMINATIONHow to Unsubscribe Youtube Channel AutomaticallyAfter the development of Youtube Shorts and its algorithm, maybe, we easily (or accidentally) subscribe to a suggested Youtube channel…Aug 1, 2023Aug 1, 2023
Rizky Maulana NurhidayatinDataDrivenInvestorHow to Create Animation using Matplotlib and CelluloidA guide to understanding animation in MatplotlibJan 3, 20212Jan 3, 20212
Rizky Maulana NurhidayatinILLUMINATIONBlanet, the Possibility to Find a Planet around the Black HoleThe scientific explanation of Miller Planet and Black Hole in the Interstellar filmJan 2, 20211Jan 2, 20211
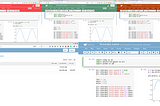
Rizky Maulana NurhidayatinTowards Data Science11 Practical Tips You Need to Know to Personalize Jupyter NotebookHow to create outstanding Jupyter User Interface using CSSNov 8, 20201Nov 8, 20201
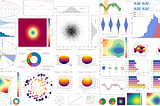
Rizky Maulana NurhidayatinTowards Data ScienceMatplotlib Styles for Scientific PlottingCustomizing Matplotlib for your scientific data visualizationOct 25, 20202Oct 25, 20202
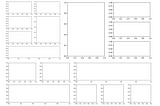
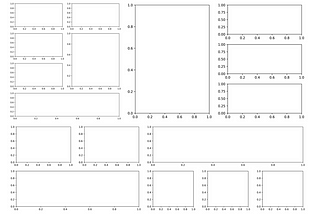
Rizky Maulana NurhidayatinTowards Data ScienceCustomizing Multiple Subplots in MatplotlibA guide to creating complex subplots in Matplotlib using subplot, add_subplot, and GridSpecOct 12, 2020Oct 12, 2020
Rizky Maulana NurhidayatinTowards Data ScienceCreating Colormaps in MatplotlibA guide to creating and customizing your own colormaps from a list of colorsOct 11, 2020Oct 11, 2020